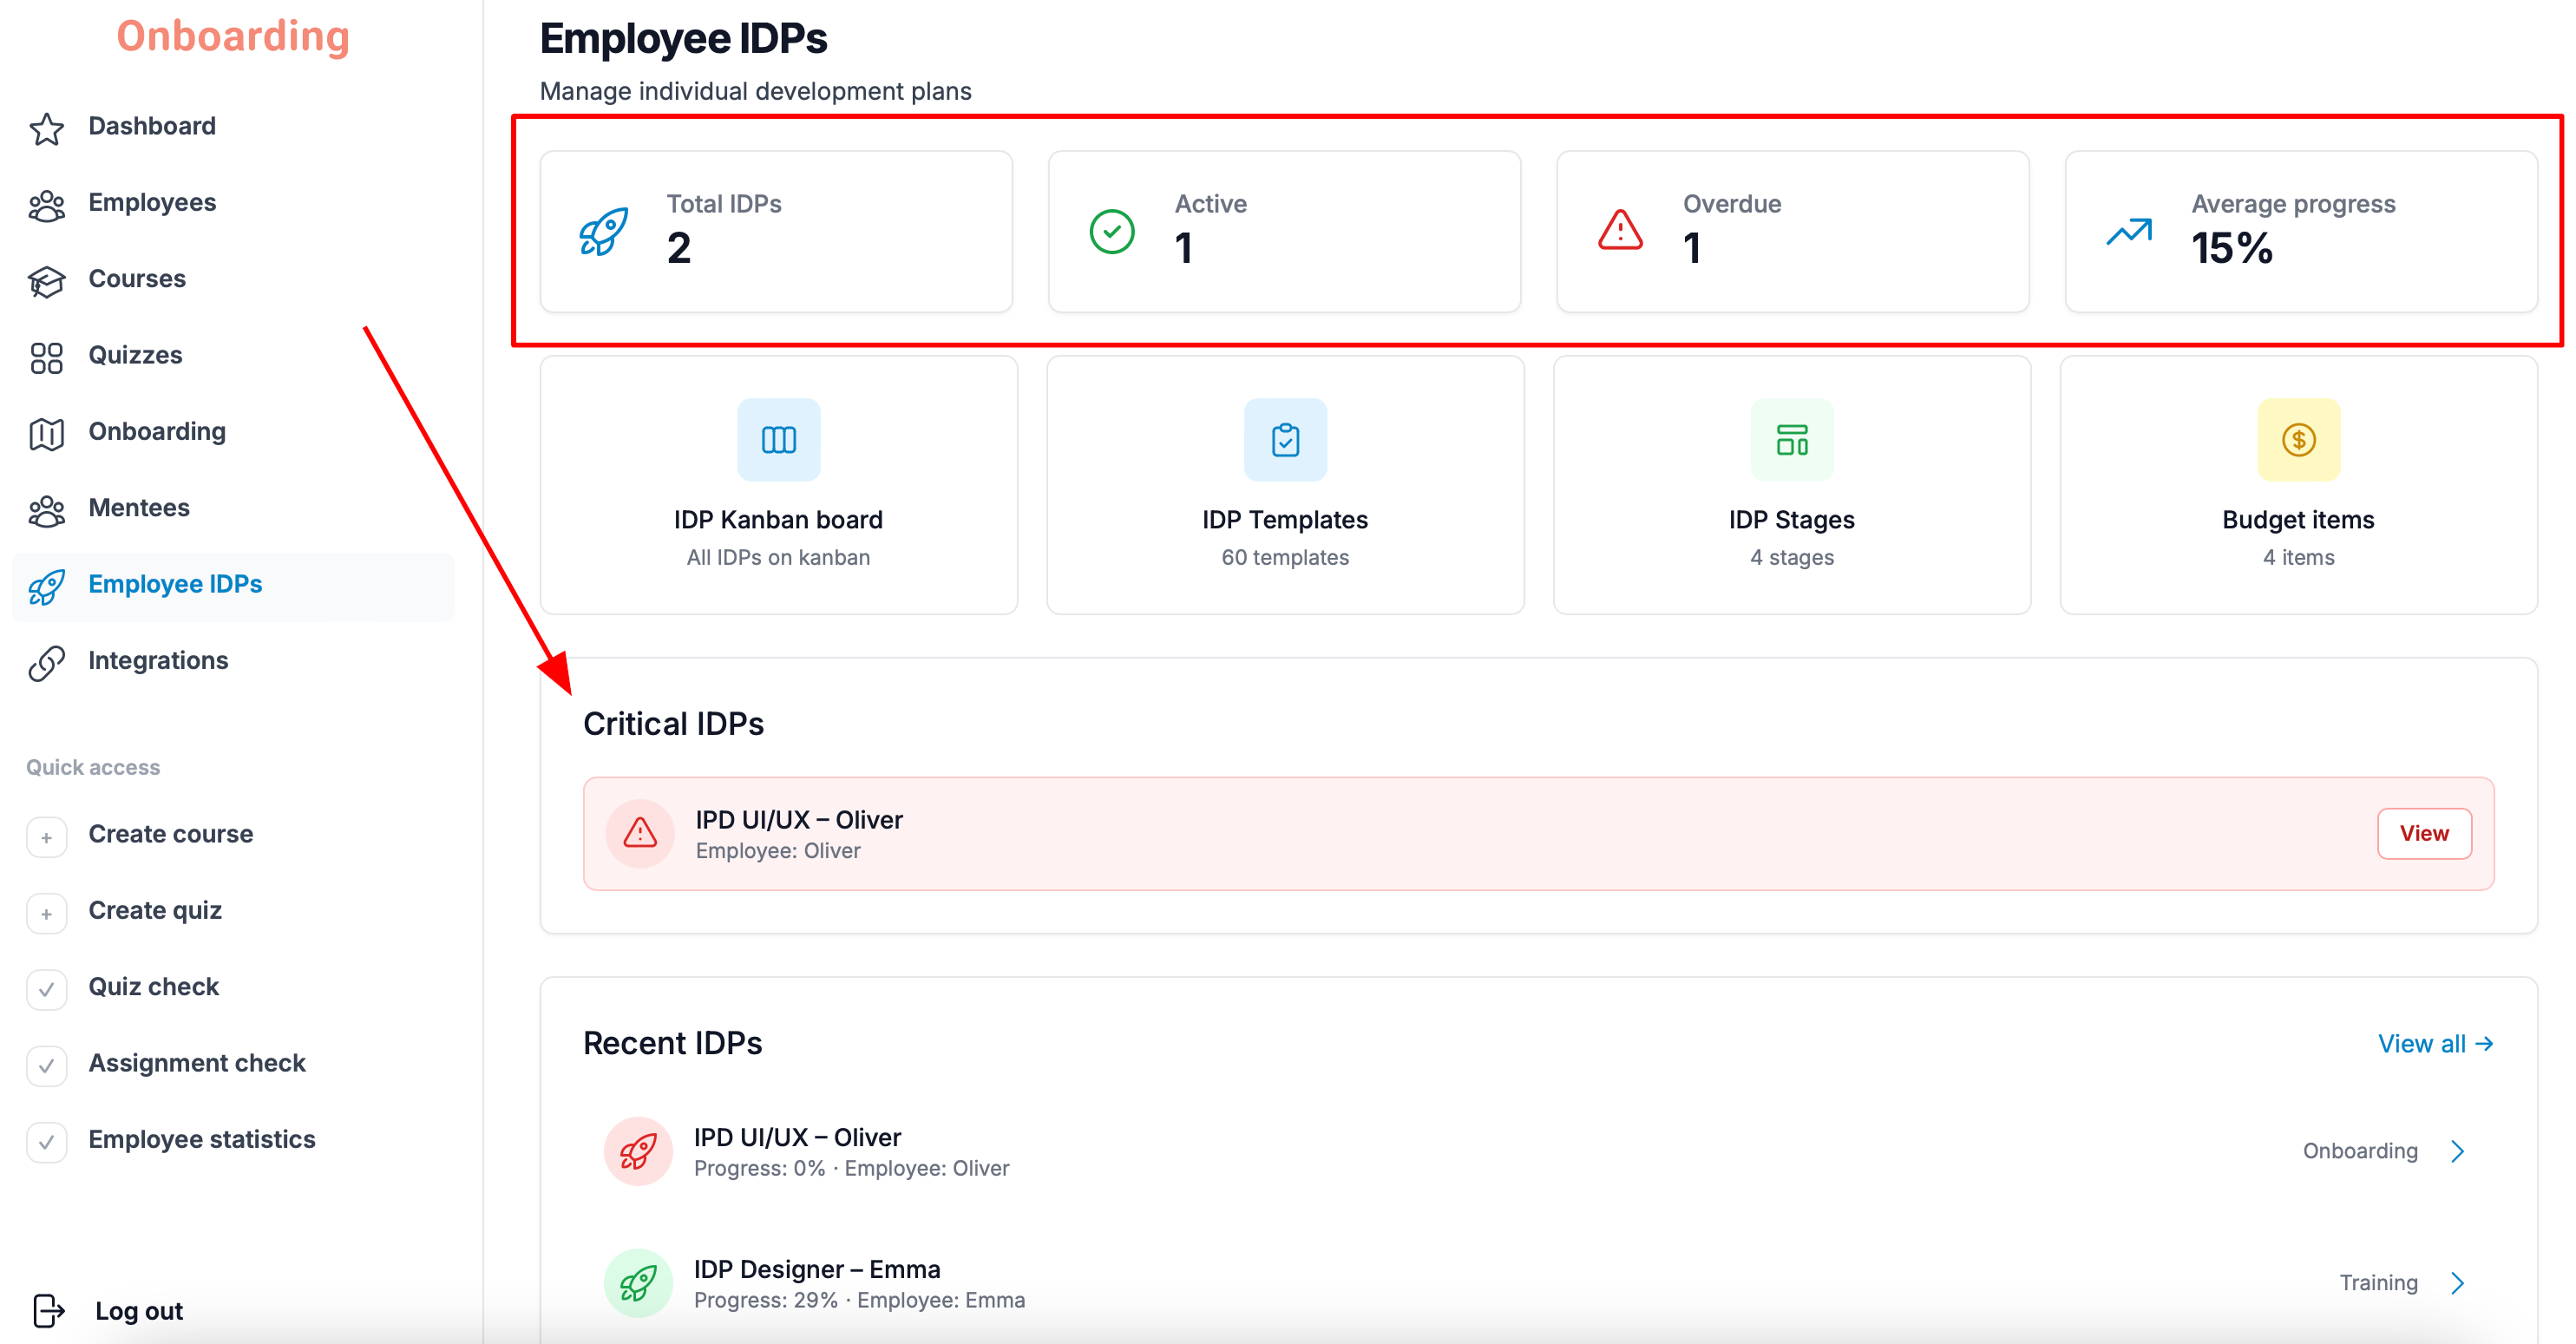
To see IDP statistics, open the «Employee IDPs» section.
The top of the page shows the overall statistics:
- Total IDPs – the total number of individual development plans created.
- Active – the number of IDPs currently in progress.
- Overdue – the number of IDPs that have missed their deadlines.
- Average progress – the average completion rate across all IDPs.
If there are overdue IDPs on the platform, they're also listed in the «Critical IDPs» block in the middle of the page.
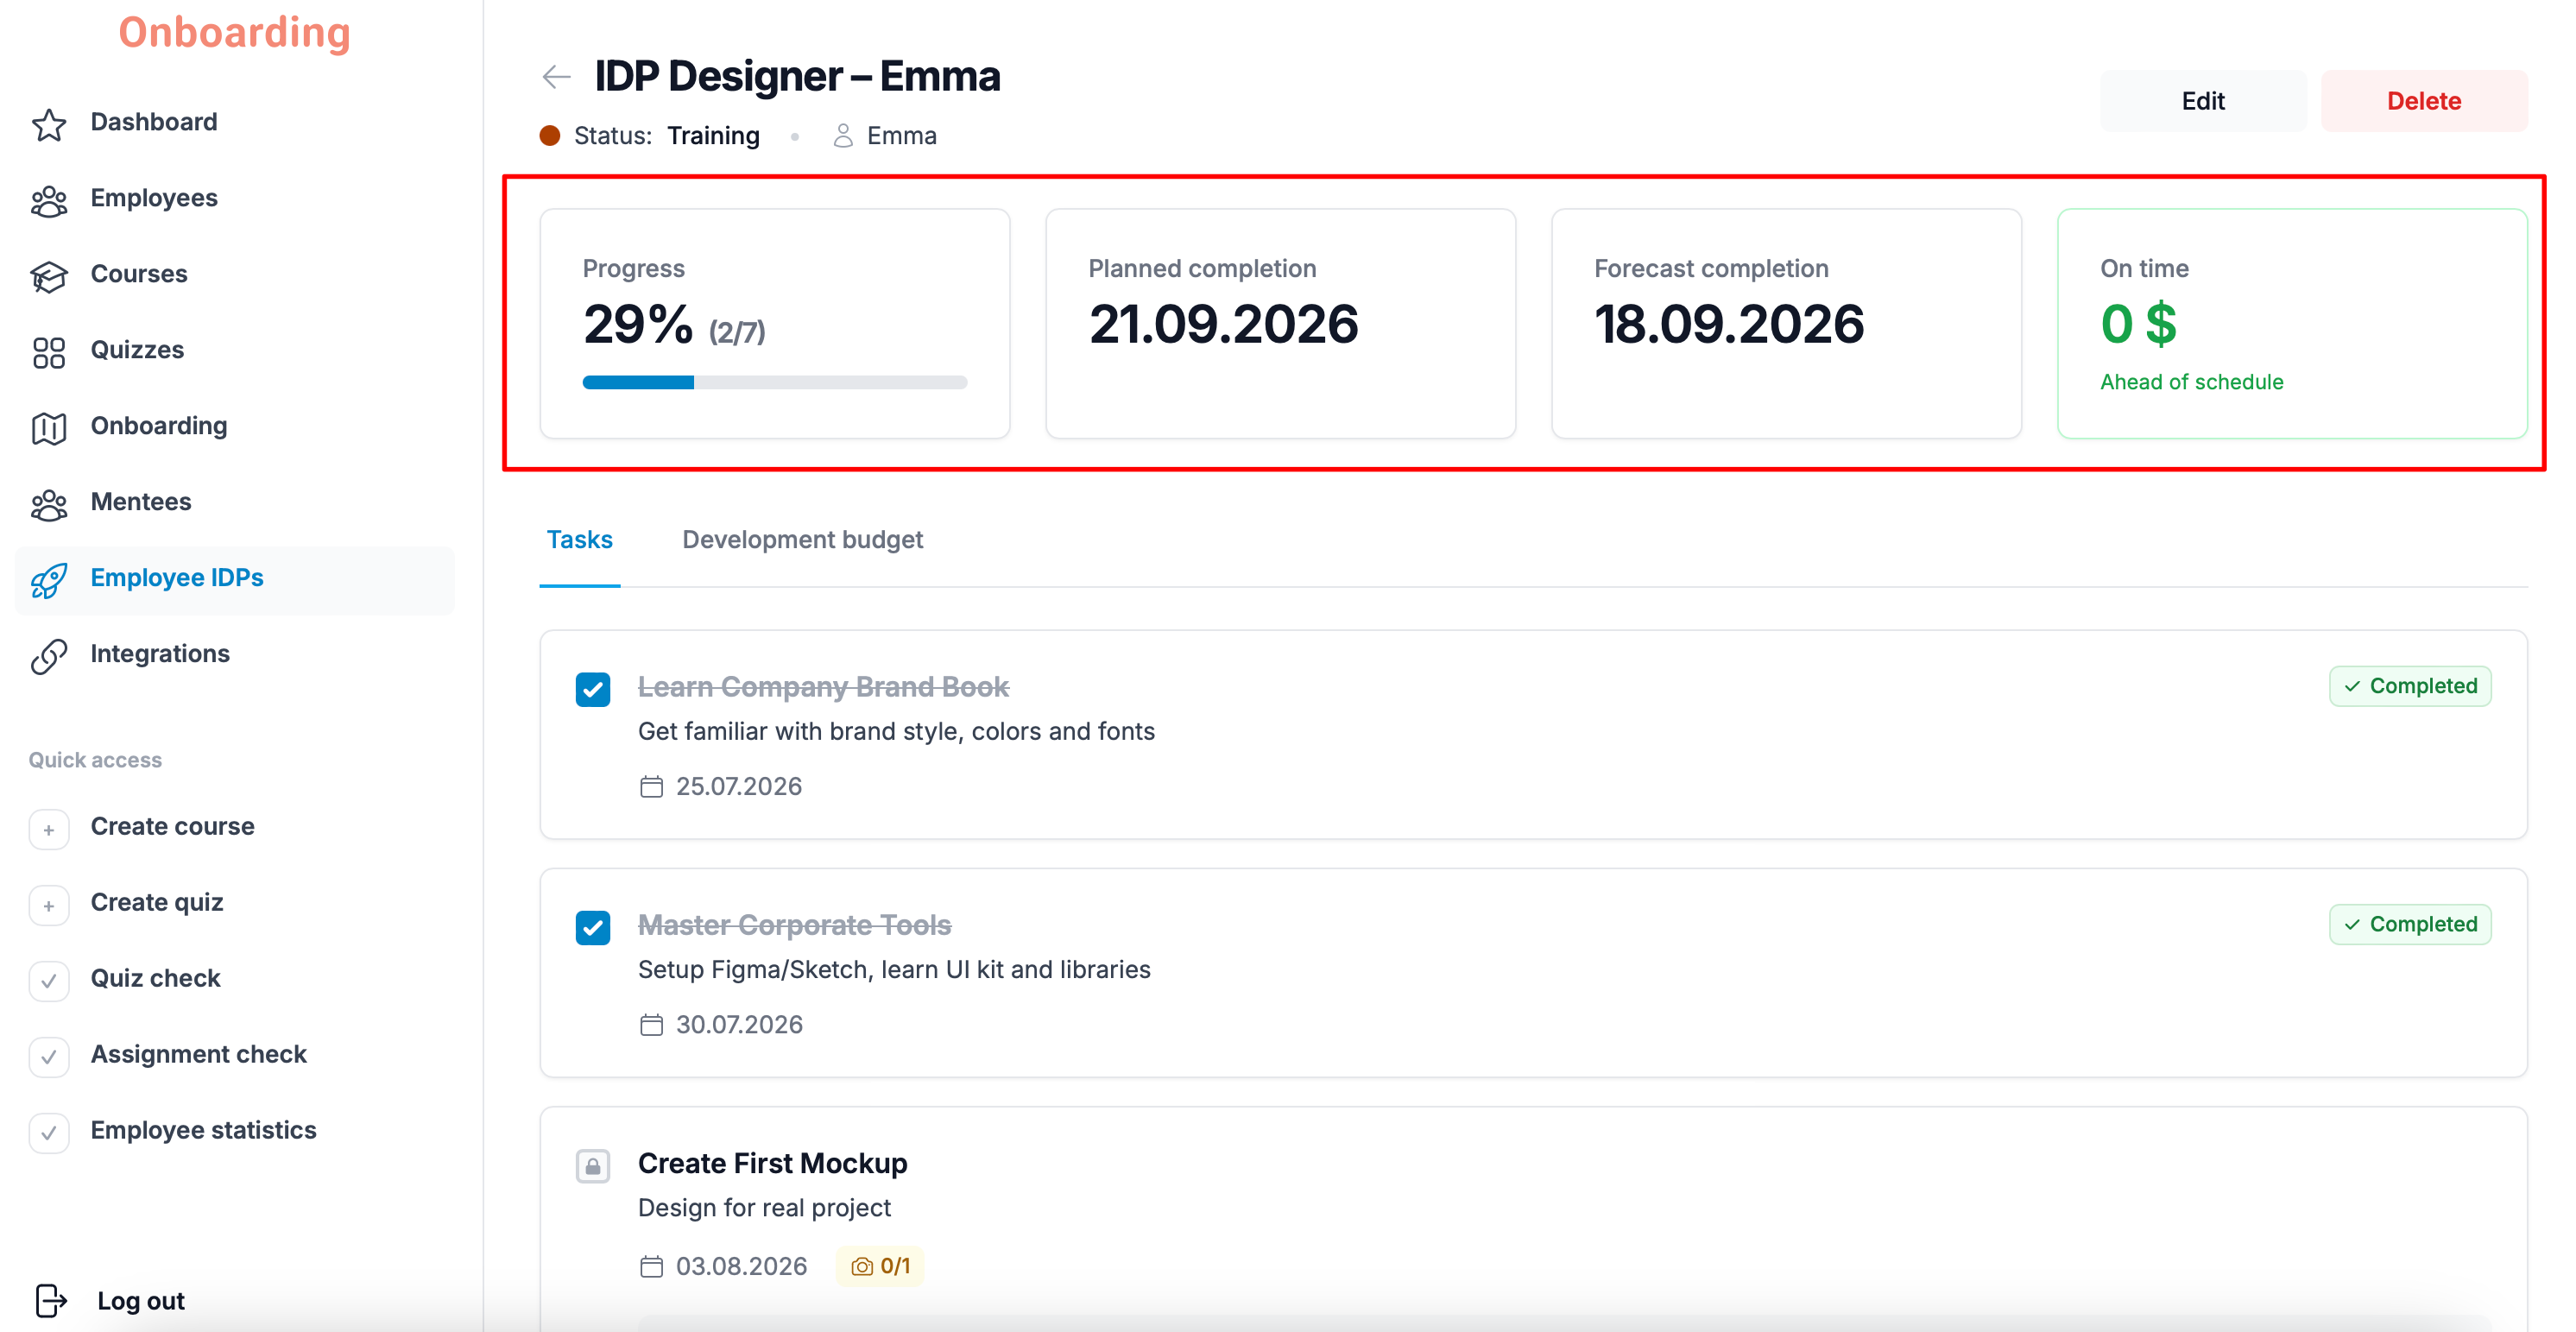
To see detailed statistics for a specific employee's IDP, pick it from the list.
The IDP's detail page shows:
- current completion progress as a percentage, and the number of tasks completed out of the total;
- the planned completion date;
- the forecast completion date based on the IDP template;
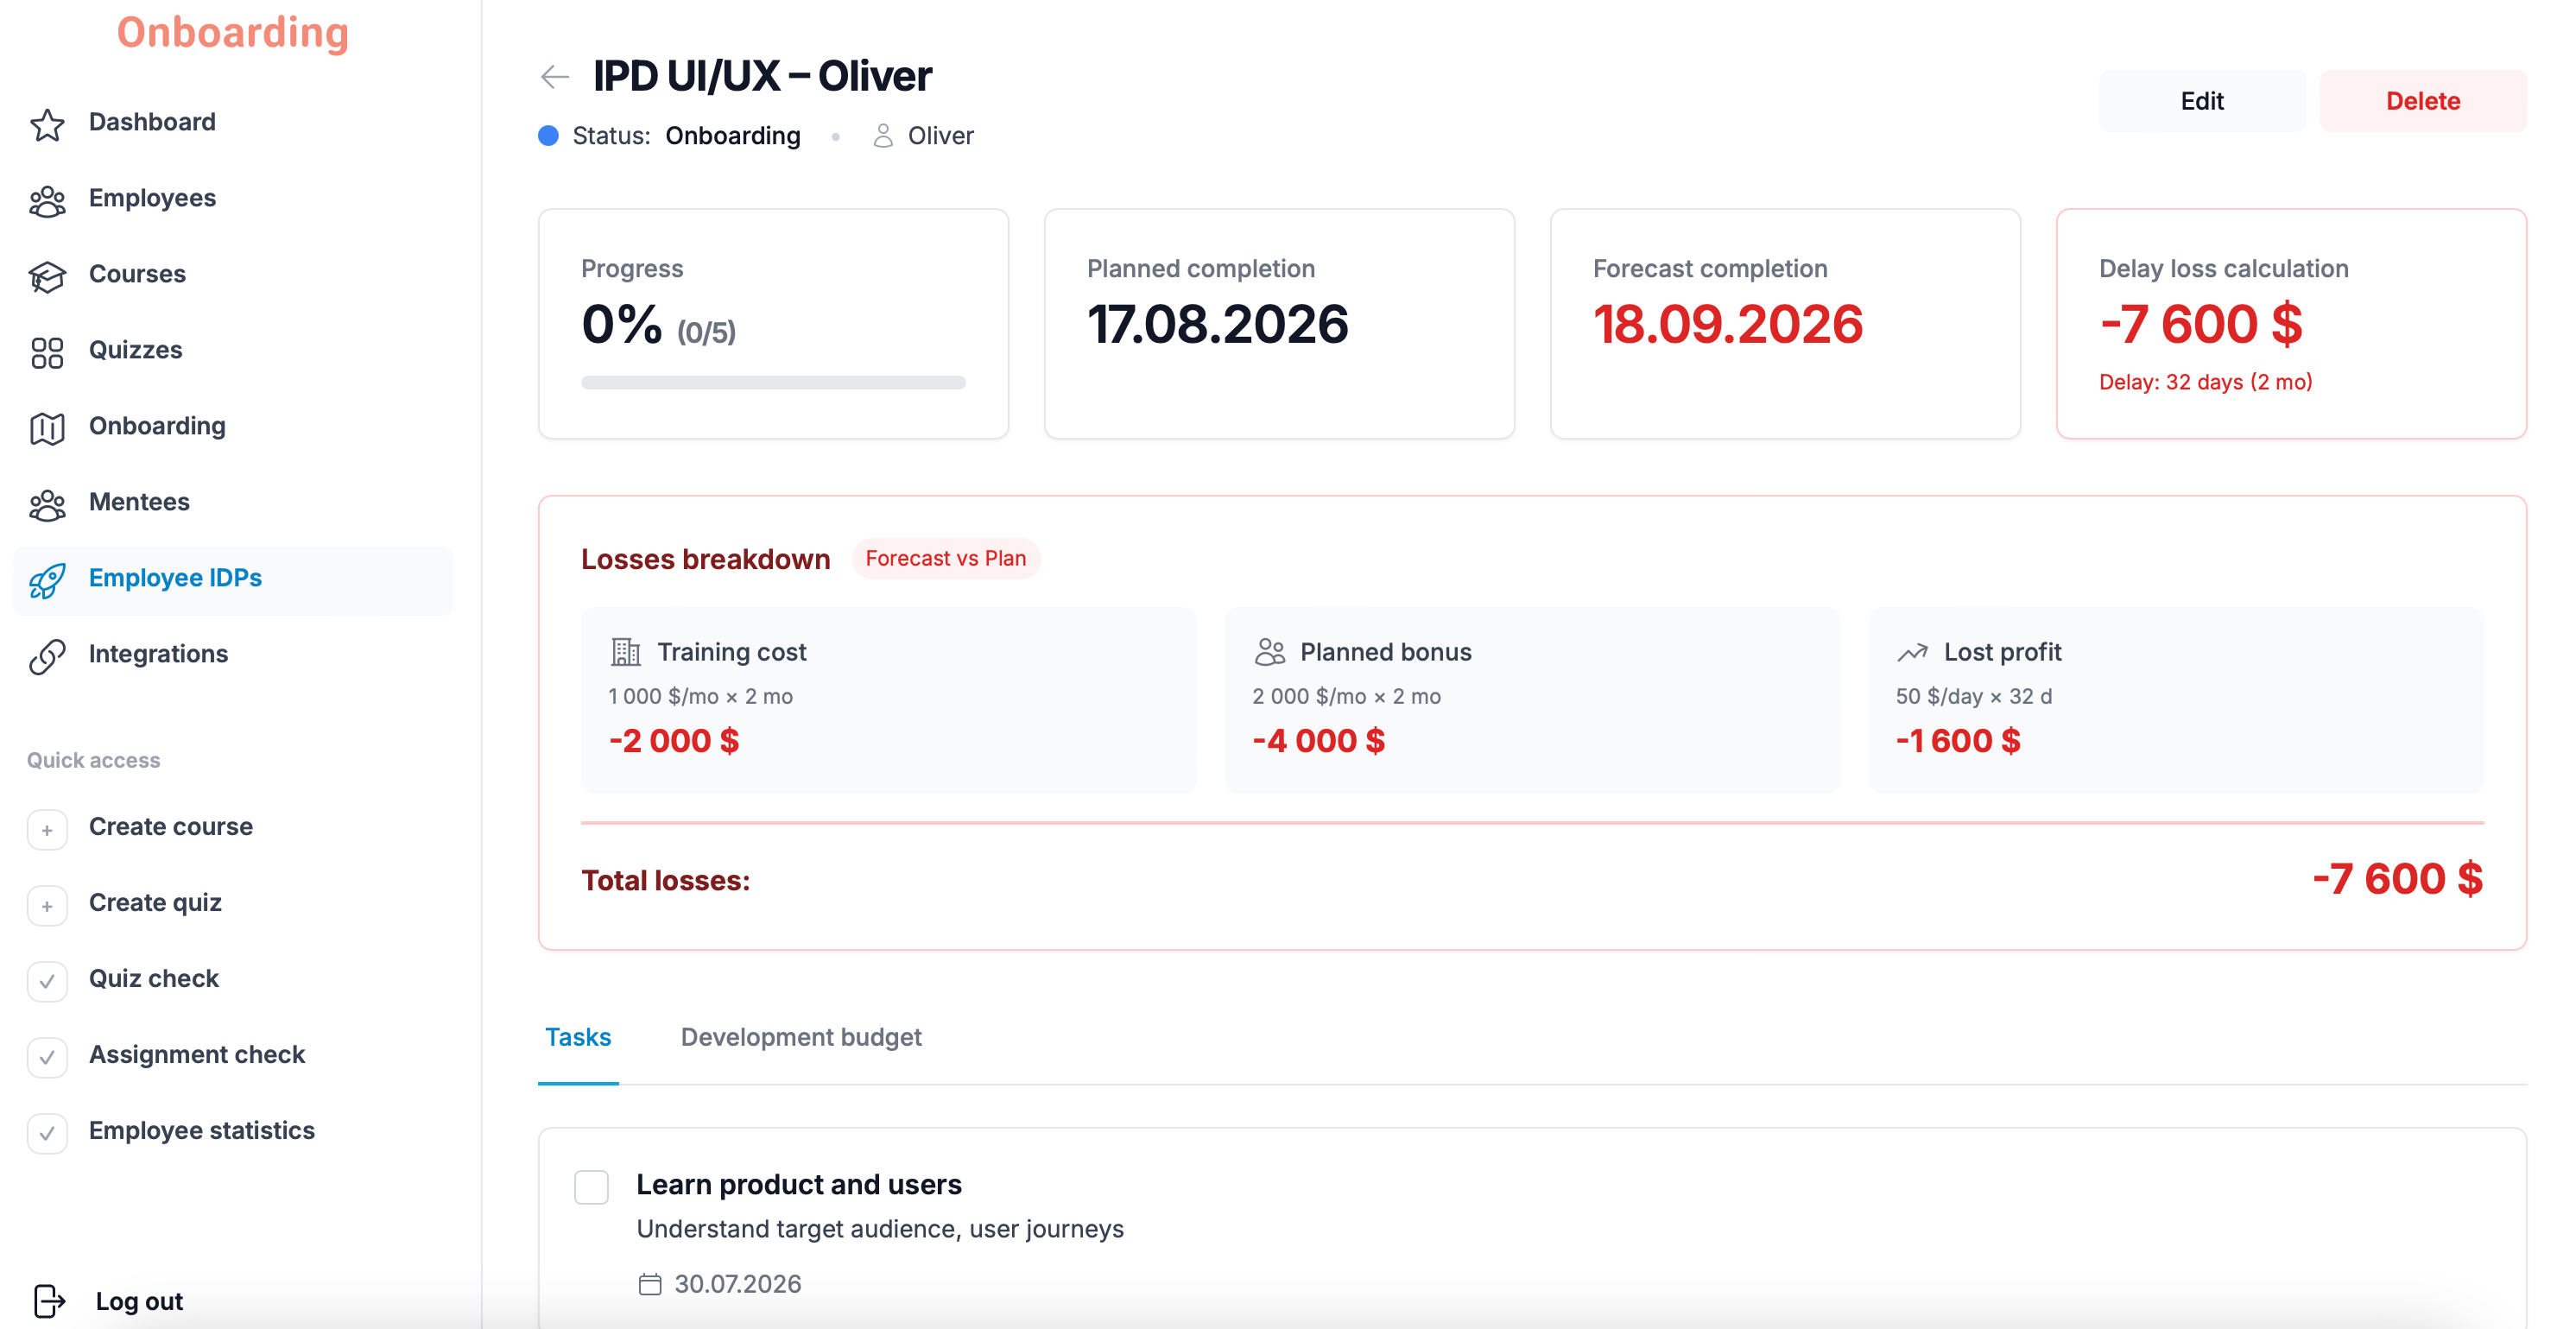
- the amount of lost productivity.
If the IDP is overdue, the platform highlights the estimated losses in red.